Monitoring SIP traffic on Kamailio with an observability stack based on Vector, Loki and Grafana
Effective operation of a VoIP platform requires end-to-end visibility into signaling activity, traffic patterns, system load and failure conditions. Achieving this level of observability is essential for troubleshooting issues, understanding traffic behavior, and ensuring service reliability. In a Kamailio based SIP infrastructure, a monitoring stack composed of Vector, Loki and Grafana offers a scalable and efficient approach to collecting, enriching, storing and visualizing SIP signaling data, providing useful insights into real-time traffic and system performance.
But what exactly Vector, Loki, and Grafana do, and how can they help in a Kamailio environment?
- Vector: allows the creation of an observability pipeline for collecting, transforming, and forwarding monitoring data such as logs, metrics, and events from multiple sources to various destinations. In our case, the source is the Kamailio log file and the destination is Loki. Vector is characterized by its flexibility, high performance, and low resource consumption.
- Loki: is a log aggregation and indexing system developed by Grafana Labs. It is highly efficient because it indexes primarily labels rather than full log content, enabling fast and scalable searches.
- Grafana: acts as the visualization layer, allowing data indexed by Loki to be queried and displayed through dashboards and charts. This enables efficient analysis of the structured SIP events collected by Kamailio and processed by Vector.
At a high level, the architecture relies on Kamailio generating structured logs that reflect the SIP call lifecycle. Vector ingests and transforms these logs, enriches them with metadata and labels, and forwards the resulting events to Loki, where they are indexed and stored. Grafana then queries Loki to provide real-time monitoring, troubleshooting capabilities, and traffic analytics.
Kamailio Log Structure
In my environment, Kamailio is configured to write logs in JSON format and operates as a stateful SIP proxy, remaining in the signaling path for the entire duration of the dialog. The objective is to generate structured log entries for each type of SIP message: received Requests (e.g., INVITE, BYE, CANCEL), forwarded Requests, received Replies (e.g., 180 Ringing, 200 OK, error responses), forwarded Replies. These events can be managed within Kamailio’s routing logic according to how Requests and Responses are processed.
- Received SIP Requests are intercepted in the request_route and processed in route { … } blocks
- Received SIP Responses are intercepted in the reply_route block and handled in onreply_route[MANAGE_REPLY]
- Outgoing SIP Requests are intercepted and managed within onsend_route
- Outgoing SIP Responses are also handled within onsend_route, but you need to enable the global parameter onsend_route_reply=yes
For these four message categories, the application logic (available here kamailio.cfg) generates INFO-level log entries containing an event parameter with the following values:
- rx-request
- rx_reply
- tx_request
- tx_reply
When a SIP Request is received, Kamailio generates the following log entry:
xlog("L_INFO","INFO: event=rx_request calldirection=$dlg_var(calldir) srcip=$si srcport=$sp callid=$ci ruri=$ru method=$rm respcode=$rs respmess=$rr cseq=$cs fromuser=$fU fromtag=$ft touser=$tU totag=$tt dsturi=$du callend=$dlg_var(callend) label='t_relay to Media Server'\n");
When a SIP Response is received:
xlog("L_INFO", "INFO: event=rx_reply calldirection=$dlg_var(calldir) srcip=$si srcport=$sp callid=$ci ruri=$ru method=$rm respcode=$rs respmess=$rr cseq=$cs fromuser=$fU fromtag=$ft touser=$tU totag=$tt dsturi=$dlg_var(dsturi) callend=$dlg_var(callend) label=''\n");
For Requests and Responses transmitted by Kamailio, the onsend_route block contains the following logic:
	if ($rs != $null) {
		xlog("L_INFO", "INFO: event=tx_reply calldirection=$dlg_var(calldir) srcip=$si srcport=$sp callid=$ci ruri=$ru method=$rm respcode=$rs respmess=$rr cseq=$cs fromuser=$fU fromtag=$ft touser=$tU totag=$tt dsturi=$dlg_var(dsturi) callend=$dlg_var(callend) label='outgoing reply to $sndto(ip):$sndto(port)'\n");
	} else {
		xlog("L_INFO", "INFO: event=tx_request calldirection=$dlg_var(calldir) srcip=$si srcport=$sp callid=$ci ruri=$ru method=$rm respcode=$rs respmess=$rr cseq=$cs fromuser=$fU fromtag=$ft touser=$tU totag=$tt dsturi=$dlg_var(dsturi) callend=$dlg_var(callend) label='outgoing request to $sndto(ip):$sndto(port)'\n");
	}
This approach produces logs with a clear and consistent structure, making them ready for processing by Vector and subsequent ingestion into Loki.
Vector pipeline
Vector transforms Kamailio generated logs into structured observability data suitable for monitoring and call analysis. It extracts relevant SIP signaling information, removes operational noise, and forwards enriched events to Loki for visualization through Grafana. The pipeline (available in vector.yaml) consists of four main stages:
- Log collection
- Event filtering
- Parsing and normalization
- Forwarding to Loki
Log Collection
The source component reads the Kamailio log file.
	sources:
	  kamailio_file:
	    type: file
		include: - /var/log/kamailio.log
		read_from: end
The read_from: end option instructs Vector to process only newly generated events after startup, avoiding ingestion of historical data already present in the log file.
Filtering Relevant Events
Not all messages generated by Kamailio are useful for call analysis. The initial filter selects only: messages generated by the Kamailio process; events produced by the xlog module; INFO level messages. At the same time, logs generated by RTPENGINE are excluded. This reduces noise and ensures that only SIP signaling related events are processed.
Parsing and Normalization
The core component of the pipeline is the remap transform, which converts textual log entries into structured events. The pipeline extracts the timestamp and the JSON payload generated by Kamailio, initializes all the required fields, and ensures that every record forwarded to Loki has a consistent schema. This simplifies both querying and dashboard creation in Grafana. Additionally, the pipeline discards locally absorbed ACK messages and Re-INVITE requests identified through CSeq inspection. As a result, structured attributes are extracted from the log stream, including the following:
	event=rx_request
	calldirection=inbound
	srcip=...
	callid=...
	method=INVITE
	respcode=200
	...
Forwarding to Loki
The final stage of the pipeline sends events to Loki.
	sinks:
	  loki:
	    type: loki
Events are serialized in JSON format and enriched with Loki labels, enabling highly efficient queries from Grafana. Examples include filtering:
- Received INVITE requests;
- All 4xx responses;
- Traffic directed to a specific system;
- Calls terminated with specific SIP response codes.
Deploying Loki and Grafana
Loki and Grafana are deployed as containers. Loki receives and stores data from Vector, while Grafana connects to Loki to query and visualize the data through dashboards, charts, and reports.
	version: "3.9"

	services:

	  loki:
		image: grafana/loki:latest
		container_name: loki
		restart: unless-stopped

		command:
		  - -config.file=/etc/loki/local-config.yaml

		ports:
		  - "3100:3100"

		volumes:
		  - ./loki/loki-config.yaml:/etc/loki/local-config.yaml
		  - ./loki/data:/loki

	  grafana:
		image: grafana/grafana:latest
		container_name: grafana
		restart: unless-stopped

		depends_on:
		  - loki

		ports:
		  - "3000:3000"

		volumes:
		  - ./grafana/data:/var/lib/grafana
Executing LogQL Queries and Building Dashboards
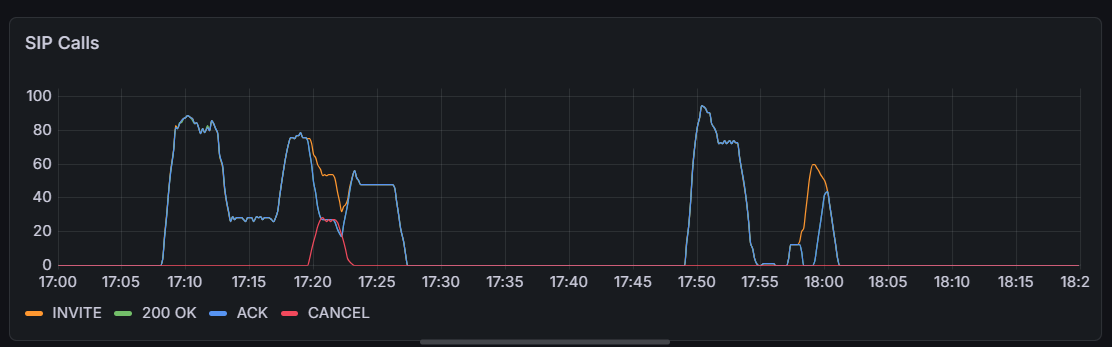
Using Grafana’s web interface, it is possible to execute queries, extract metrics, and create dashboards. For example, the observability pipeline described in this article can be used to visualize received calls and successfully connected calls through the following queries.
	sum(
	  count_over_time(
      {app="kamailio",event="rx_request",method="INVITE"}[1m]
	  )
	)

	sum(
	  count_over_time(
      {app="kamailio",event="rx_reply",method="INVITE",respcode="200"}[1m]
	  )
	)

	sum(
	  count_over_time(
      {app="kamailio",event="rx_request",method="ACK"}[1m]
	  )
	)

	sum(
	  count_over_time(
      {app="kamailio",event="rx_request",method="CANCEL"}[1m]
	  )
	)
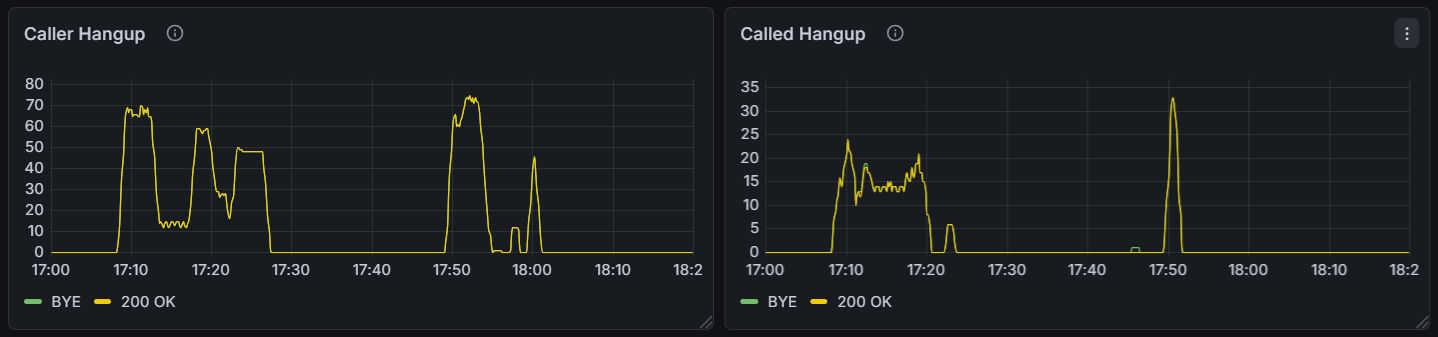
It is also possible to visualize calls terminated by the caller versus calls terminated by the called party using the following queries.
sum(
  count_over_time(
    {app="kamailio",event="rx_request",method="BYE",callend="caller"}[1m]
  )
)

sum(
  count_over_time(
    {app="kamailio",event="rx_reply",method="BYE",respcode="200",callend="caller"}[1m]
  )
)

sum(
  count_over_time(
    {app="kamailio",event="rx_request",method="BYE",callend="called"}[1m]
  )
)

sum(
  count_over_time(
    {app="kamailio",event="rx_reply",method="BYE",respcode="200",callend="called"}[1m]
  )
)